The LP dashboard in Copia Connect gives investors a clear, private window into their commitments, capital flows, and documents all in one view. Members can see where their capital stands, explore each investment in detail, and access every related file without relying on email threads or manual reports.
Dashboard
Your member dashboard provides a complete overview of your investment activity at a glance.
At the top, you’ll see your key capital metrics:
-
Total Committed: How much capital you’ve agreed to invest.
-
Total Funded: How much of that capital has been deployed.
-
Total Distributions: The total amount returned across all investments.
-
Unreturned Capital: Your remaining invested balance.
These high-level figures offer a live snapshot of exposure and liquidity, helping members understand not just what they’ve invested, but what’s been realized and what’s still at work.
Beneath these metrics, you’ll find every active, completed, and inactive investment organized into clean, visual cards. Each card surfaces critical details—such as committed amounts and distributions—so you can spot status and performance instantly.
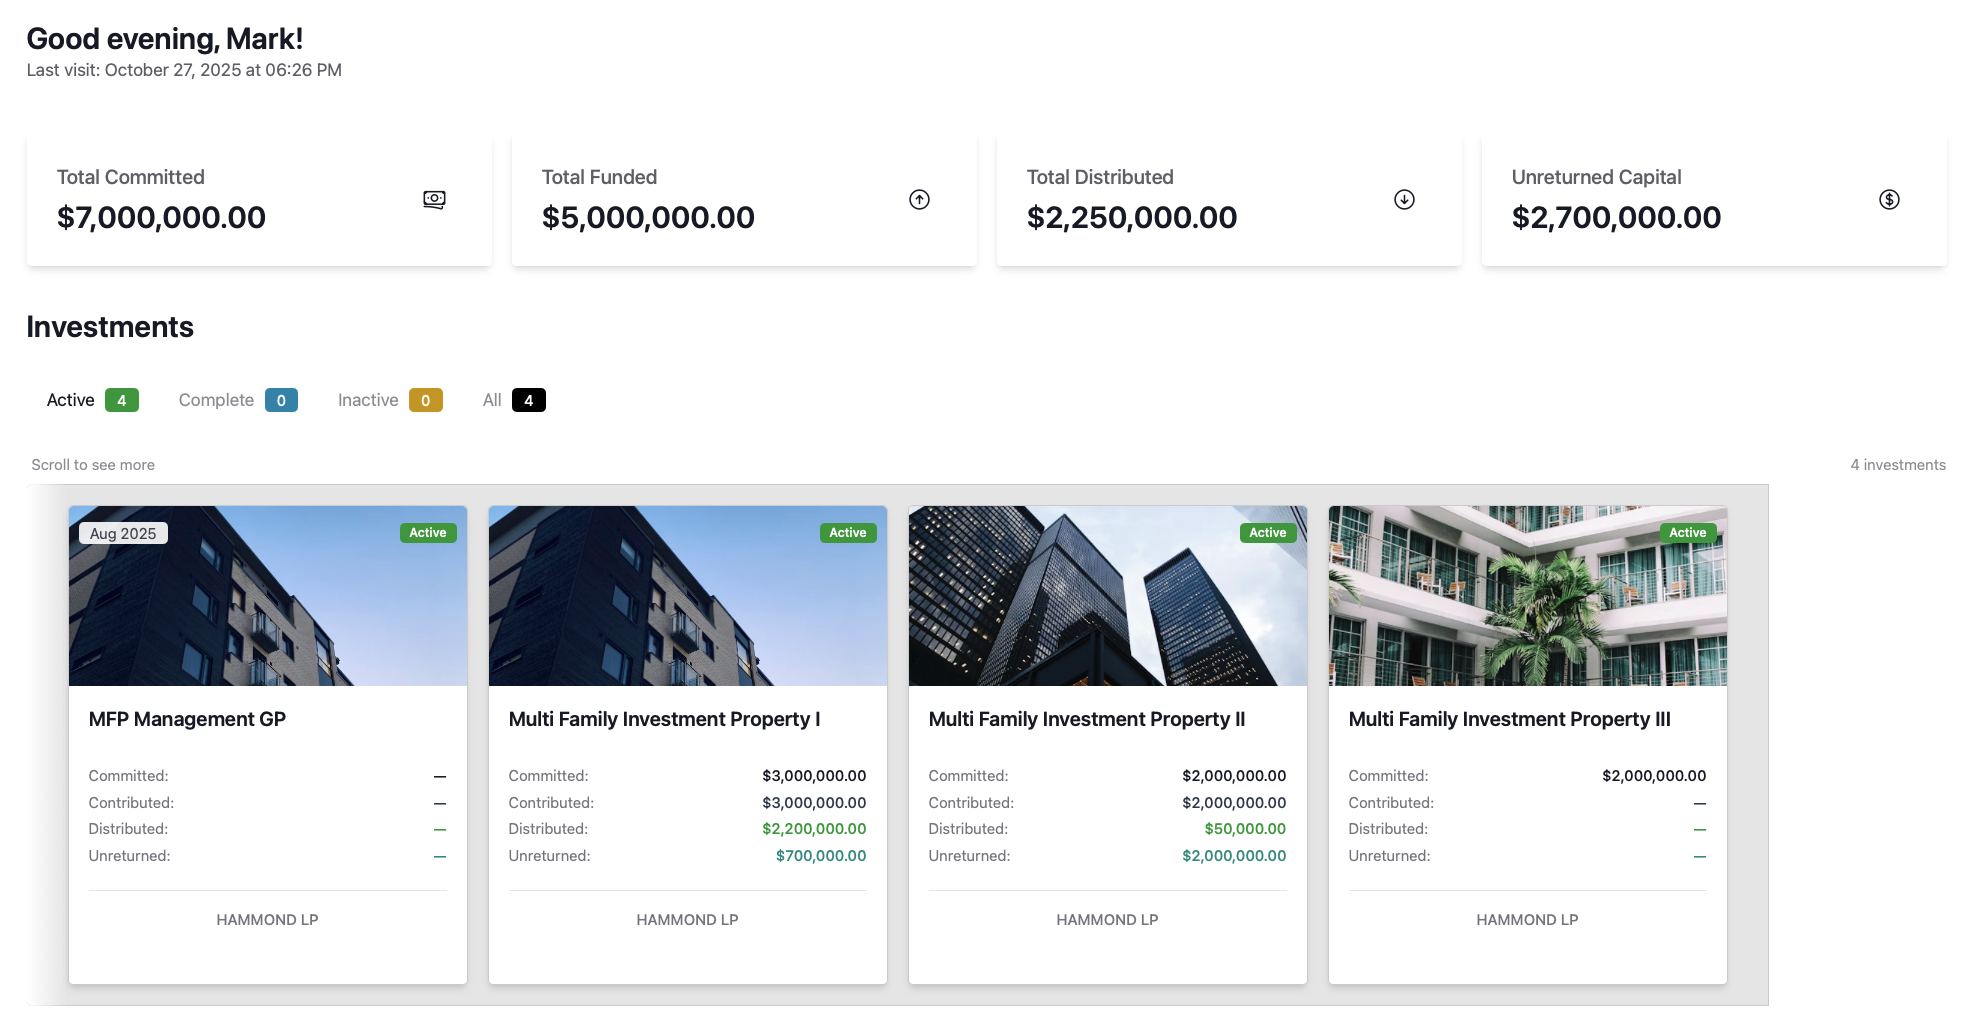
Example: An LP can log in and immediately see that $7M has been committed, $5M deployed, and $2.25M returned, across multiple real estate vehicles.
Documents
The Documents section brings every investor file into one centralized view. Documents are automatically categorized by year, by investment, or by type (for example, K-1 Tax Documents or Prospectuses).
From here, members can:
-
View or download files directly from the browser
-
See document counts across all investments
-
Expand each section for historical documents by year
Whether it’s a single K-1 or an archived offering memorandum, every file stays tied to its related investment record—making audits and annual reviews effortless.
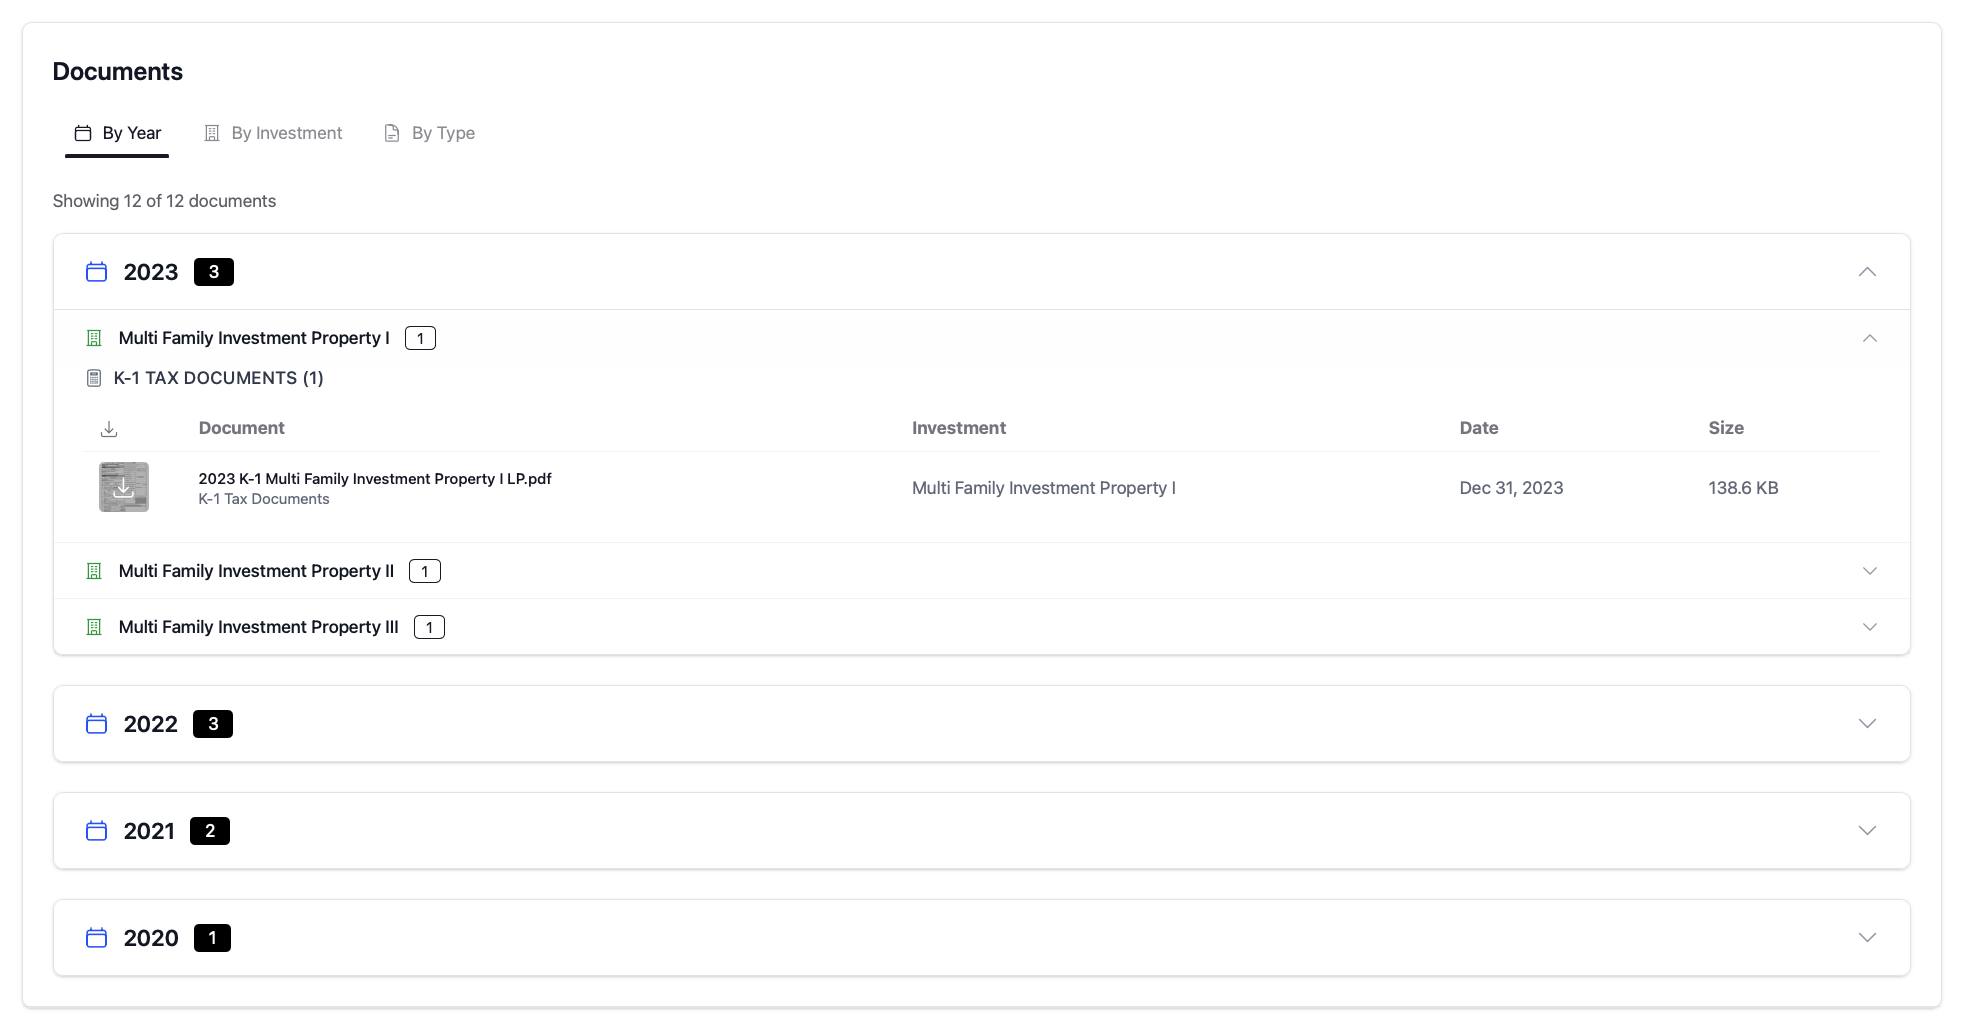
Why it matters: No more searching across portals or emails. Each document is automatically connected to its investment for fast retrieval.
Contributions & Distributions
The dashboard also includes a roll-up summary of all contributions and distributions. These tables let you drill into both categories to view transaction-level details.
Each entry shows:
-
Legal entity and venture (e.g., HAMMOND LP → Multi Family Investment Property I)
-
Type (Capital Call, Return of Capital, Income, etc.)
-
Amount and date
You can expand the list or click into any item to trace how much was called, funded, or distributed.
Quick ratios like MOIC (Multiple on Invested Capital) and Cash on Cash Return appear automatically—providing an instant sense of realized performance across the portfolio.
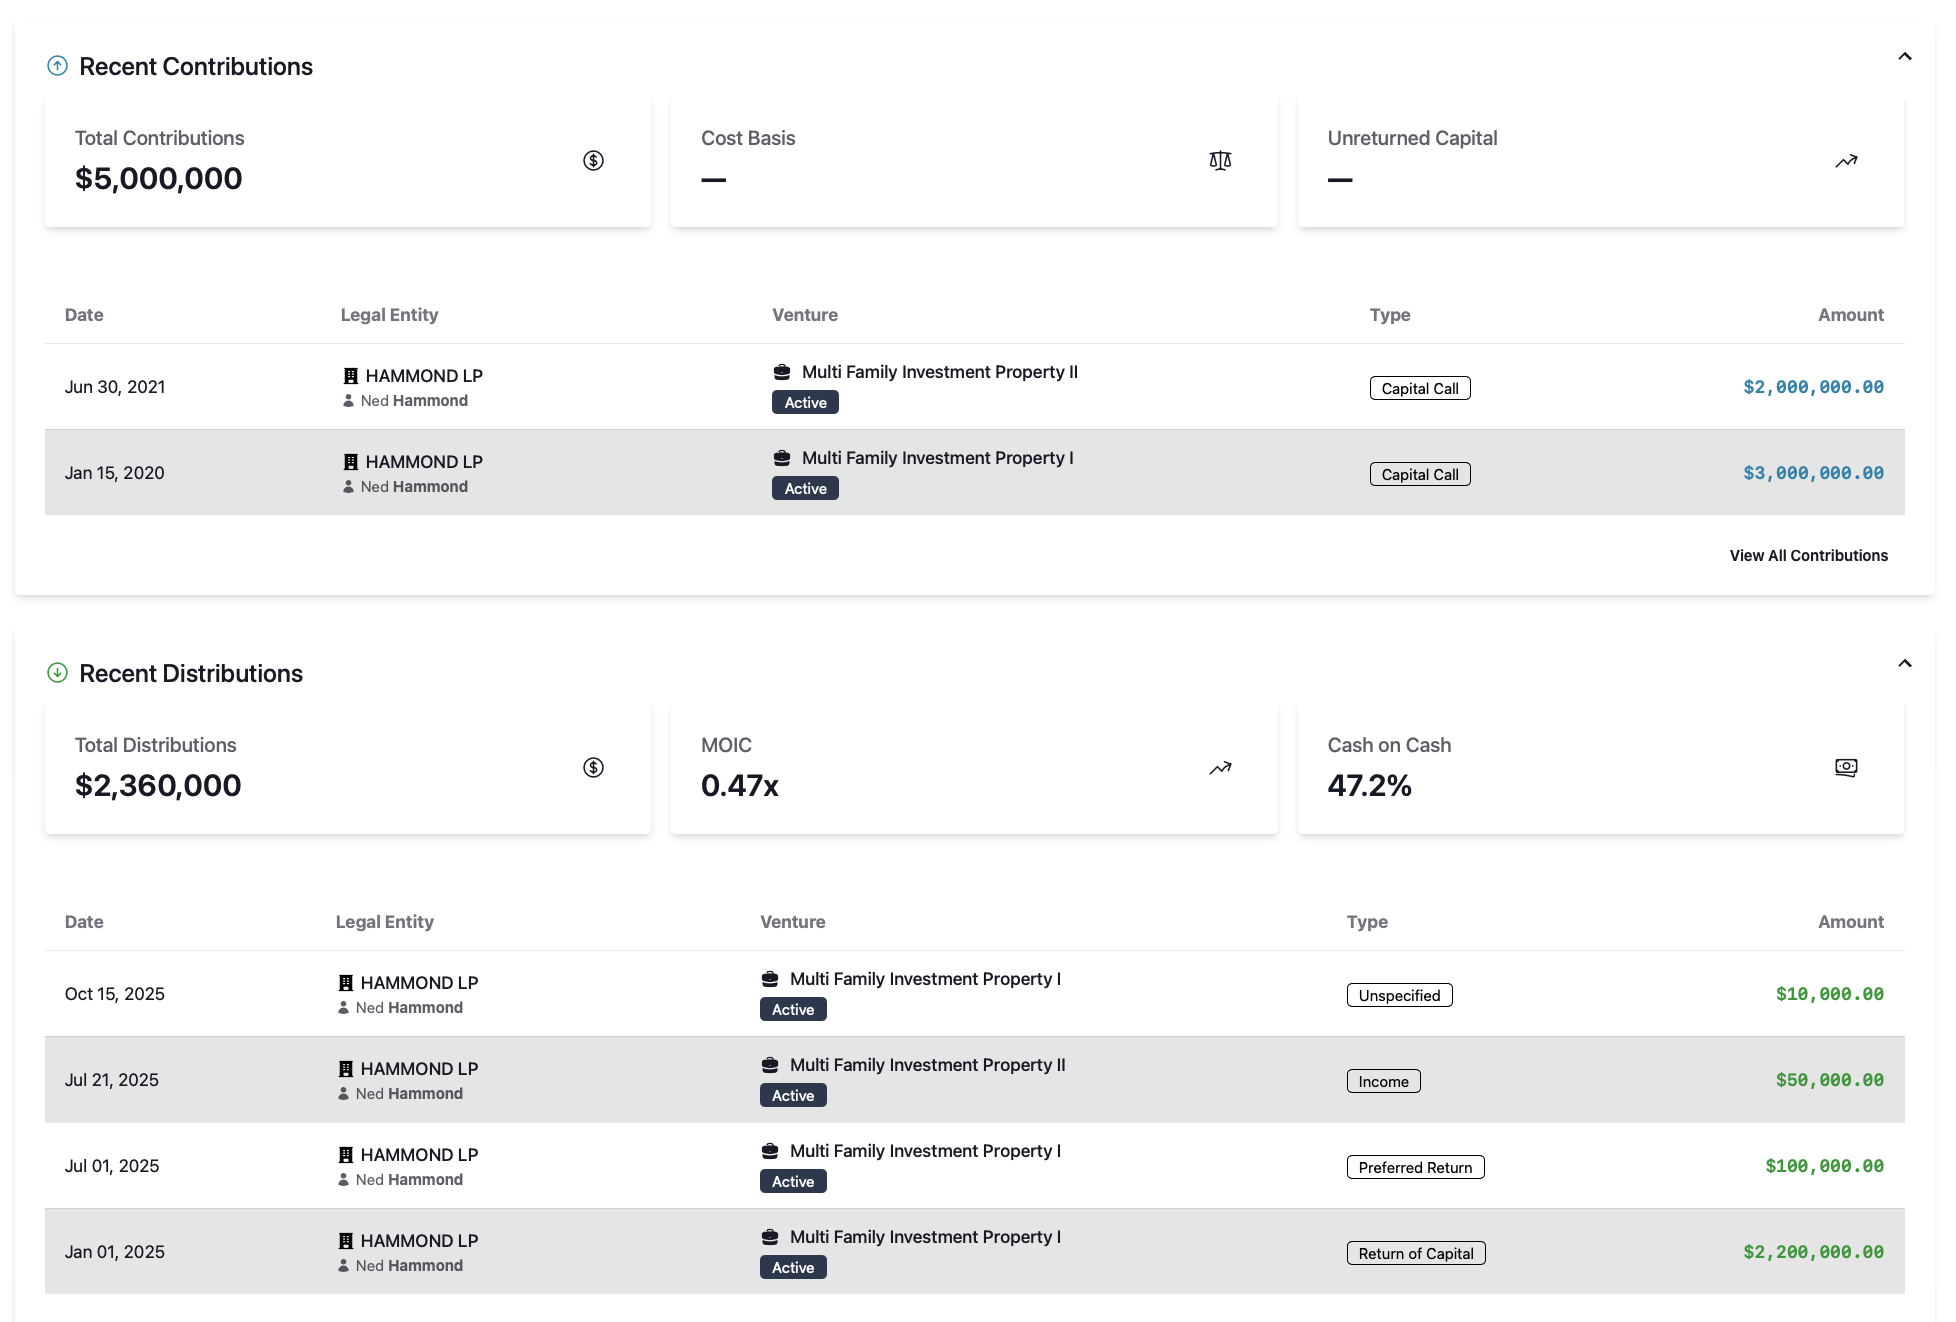
Investor insight: See how each dollar has moved, from initial contribution through every distribution, without building a spreadsheet.
Investment Details
Clicking into any investment opens the Investment Details view, where members can explore specific information tied to that asset or fund.
This view includes:
-
Investing entity and related contact information
-
Commitments and contributions
-
Distributions and returns
-
Transaction history and documents
-
Geographic map and addresses
Each detail view expands into investment activity charts and document panes, letting members cross-reference capital activity with source files in real time.
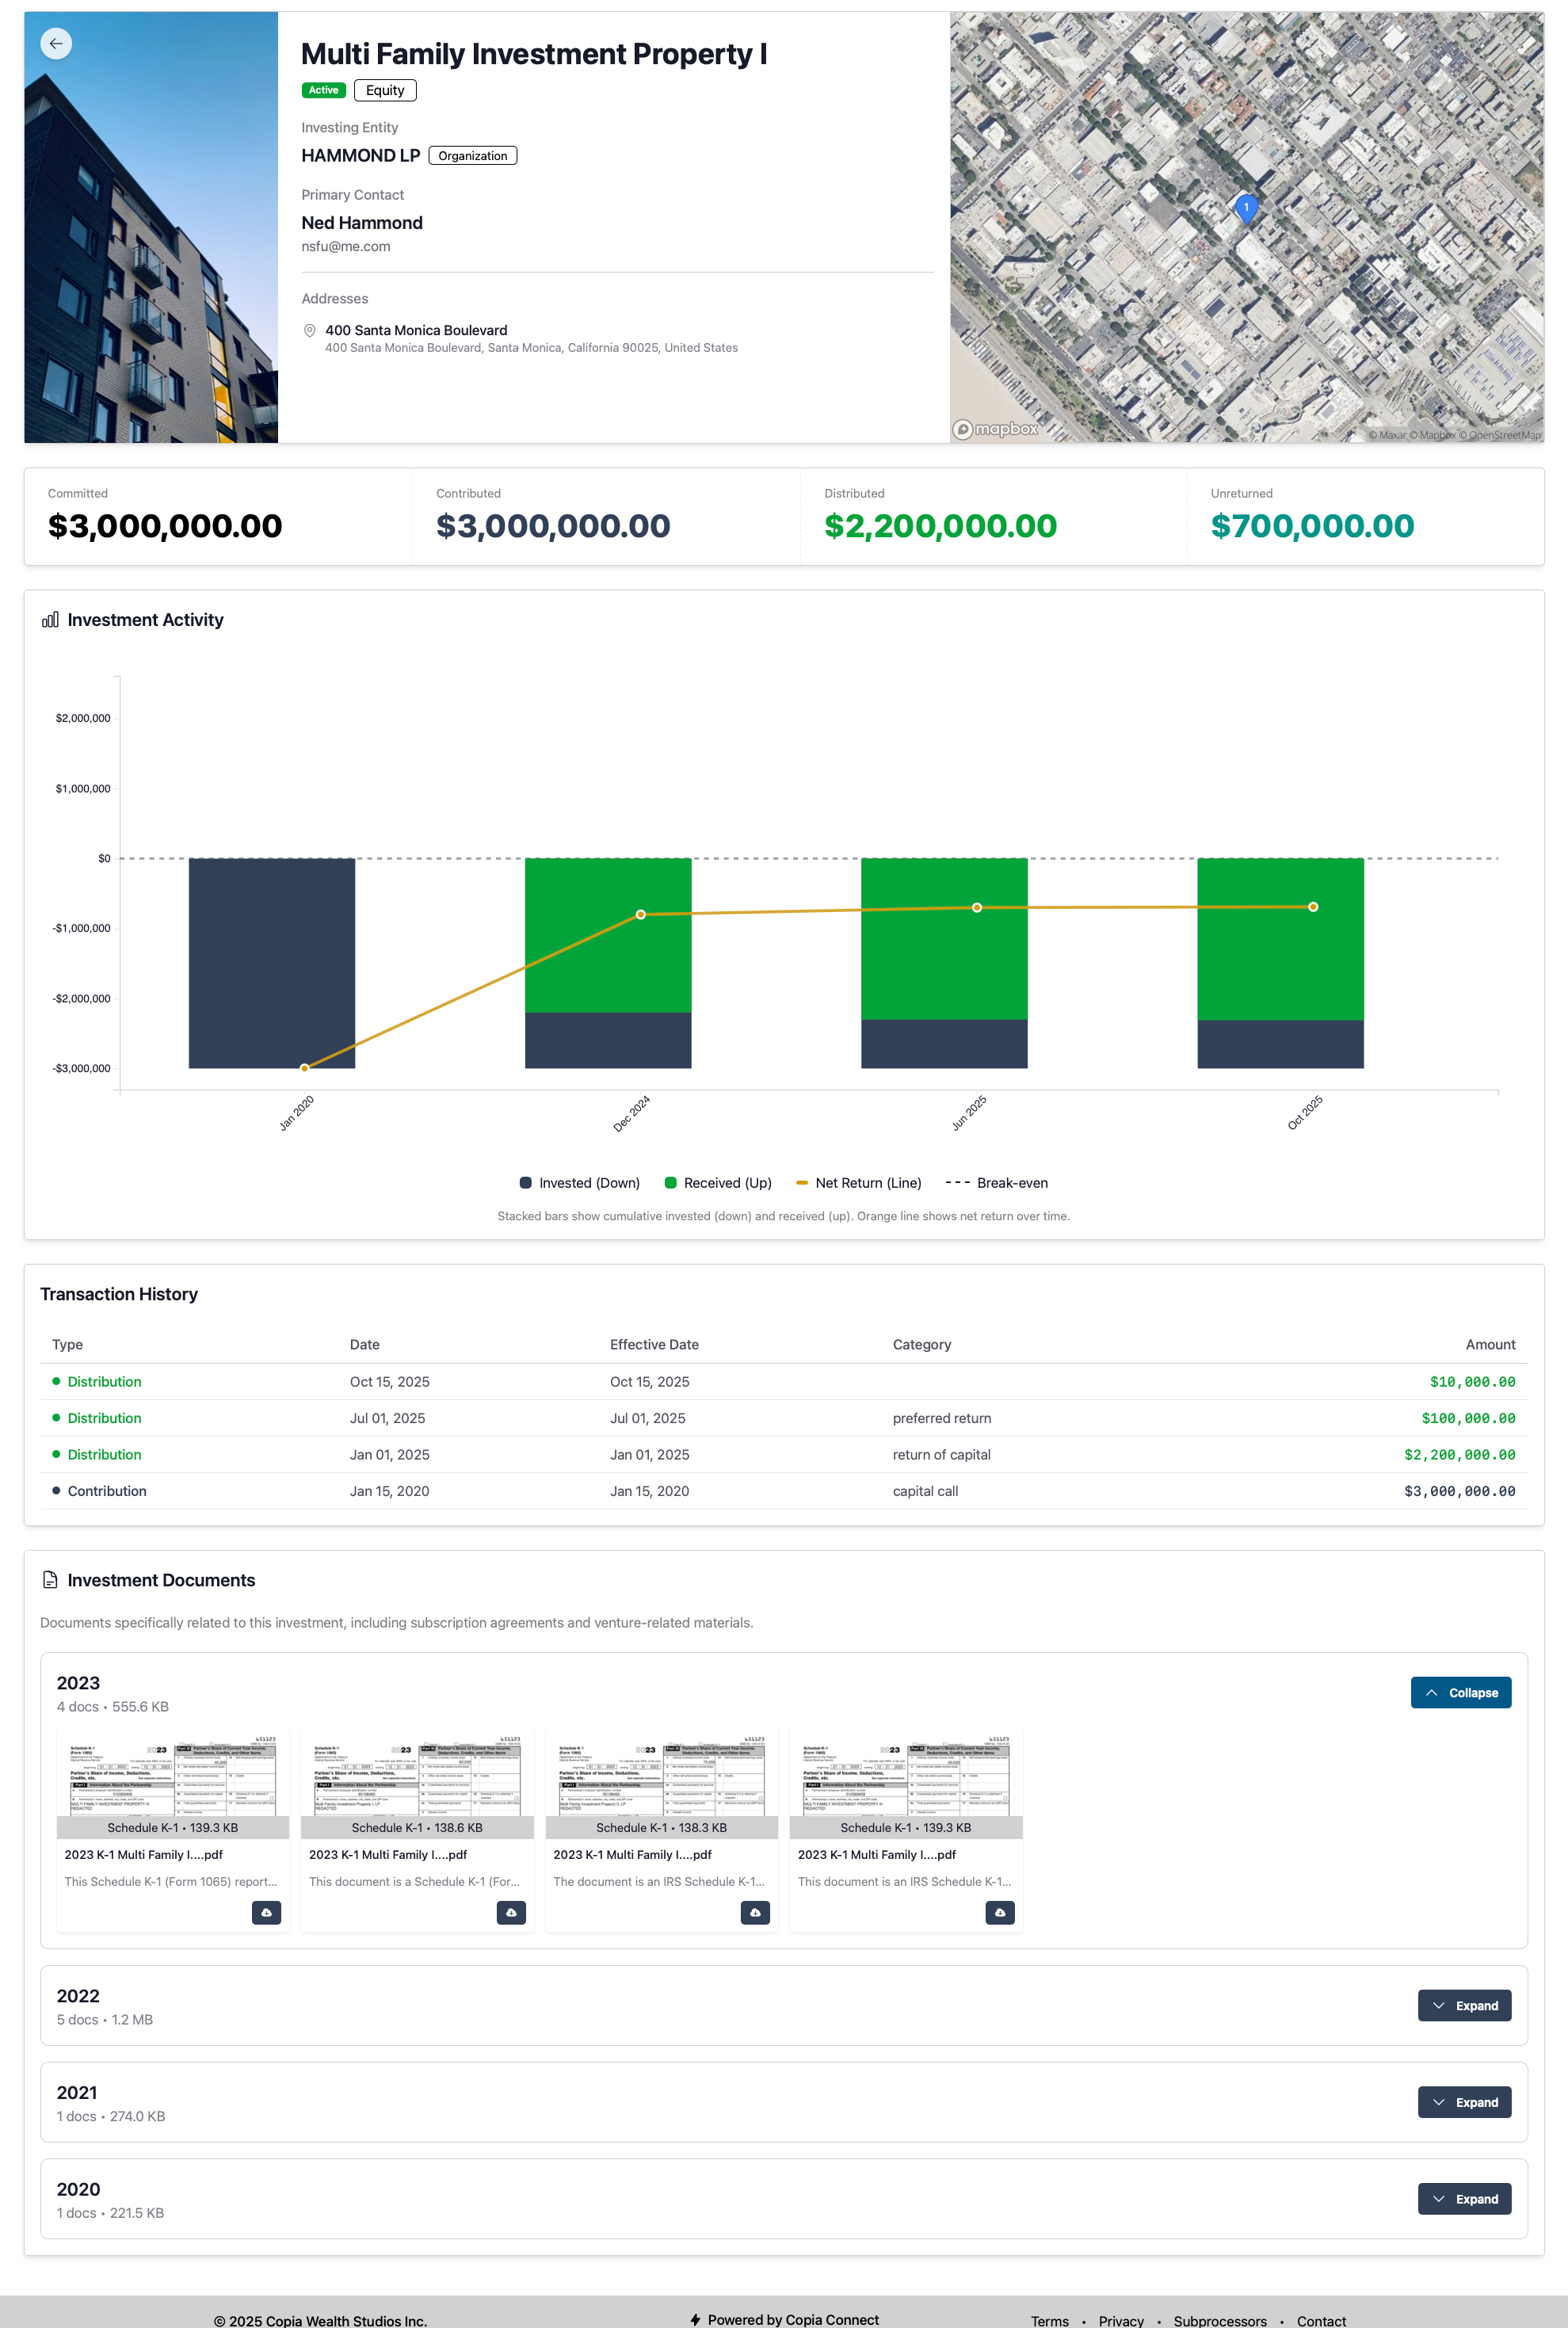
Example: A member viewing “Multi Family Investment Property I” can see $3M contributed, $2.2M distributed, and $700K still at work—plus download the supporting documents directly from the same page.
Summary
The LP experience in Copia Connect provides more than numbers—it gives context. Every investment, document, and transaction is connected through a unified record. Members gain transparency into their capital lifecycle, confidence in their data, and one source of truth for all investment information.