
Your home for lenses and metrics at a glance.
Your Wealth Row
Net Worth Statement
 The Net Worth statement allows you to see the Wealth Owners entire Net Worth including Assets and Liabilities in one view.
- Assets - Here you can see assets that compose of the net worth in the respective office. These can be broken down into liquid and illiquid assets.
- Liquid Assets refer to investments that can be bought or sold quickly while not altering the asset's price.
- Illiquid Assets are assets that are not easily convertible to cash due to a lack of ready buyers and sellers.
- Liabilities - Here you can see the liabilities that are factored in the net worth calculation in the respective office. Net Worth is essentially total assets - total liabilities.
- Dates - Here you can alter the dates that are viewed on the net worth statement in order to compare net worth over time. You can even adjust for time metrics such as Quarter to Date and Year to Date.
Liabilities can be further broken down into two categories.
Debt: Debt refers to an obligation to repay borrowed money that involves a contractual agreement with set terms for repayment, interest rate, and a specified timeframe
Credit: Refers to an obligation to repay funds drawn from a pre- approved limit, involving a contractual agreement with terms for repayment and interest rates, typically without a specific repayment timeframe, allowing for flexibility in the usage and repayment of funds.
Portfolio Value
 In the Portfolio Value lens you may see the Portfolio Market Value/ Net Investment as well as Income generated by the Portfolio.
- Market Value - See the total market value of the portfolio as of the given date. Market Observations control the blue graph line.
- Net Investment - See the total net investment put into the portfolio. This can be lower or greater than its corresponding market value. This is represented by the gold line.
- Value/Income View - Currently you are viewing the Portfolio value over time. In order to switch views simply switch to Income which will give you the Portfolio Income over time
- Time - These options correspond to how far back in time you want the graph to go ranging from the last 12 months all the way until All Time
Net Investment = Net Investment is Copia’s representation of the approximated net capital invested in an asset, defined as Total Invested Capital minus all Realized Amounts = (Total Invested Capital – Realized Amount(s))
Income by Asset Class
 In the Income by Asset Class Lens, you can explore the sources of your income by asset class. You can adjust by period of time and dollar amount/percentage.
You can also click into an Asset Class to see a look through of the underlying assets and the income they generate.
Entities Map
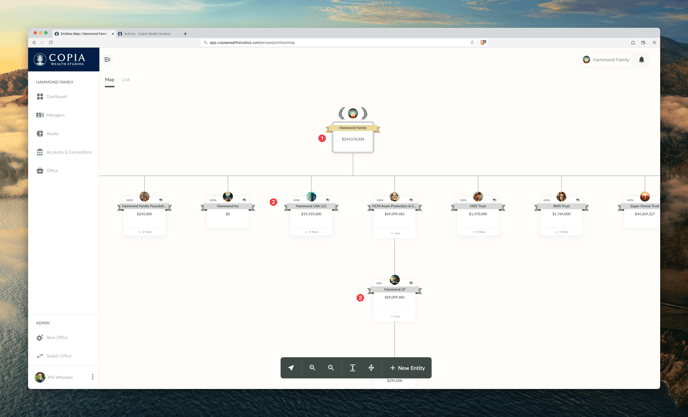
- Root Entity/Family Office - This is the Root Entity which represent the family office so in this case the Hammond Family
- Entities - These Entities are owned by the Root Entity and have a variety of Sub Entities
- Sub Entities - These entities are entirely owned by one entity or partially owned by a variety of entities
By clicking into any of the entities we get a summary page. We can also click a variety of the sub headers for information on General Details, Accounts, Assets and Documents owned by the Entity.

Composition Row
Allocations & Comparables
The Allocations & Comparables lens allows you to view your Asset Class allocation versus comparable portfolios.

- Entity: Select the respective entity you want to compare against comparables in this drop down menu. This will be represented by the blue block in the graph below
- Comparable: Select the comparable you want to compare it against over here. This will be represented by the gold block in the graph below.
- Percentage vs Monetary Amount: Select whether you want to see allocations & comparable in their respective percentage of monetary amounts.
- Create Custom Allocation: Here you can create a custom allocation to compare against the entities allocations.
You can also create a Custom Target Allocation by clicking the button. Here you can add respective amounts for each asset class.

Illiquid Breakdown
 The Illiquid Breakdown lens allows you to view information regarding your illiquid Assets Market Value/Net Investment, Gain/Loss and Net IRR.
- Asset Class - A list of asset classes. Furthermore, by clicking the arrow each asset class will expand showing a list of their respective illiquid assets.
- Estimated Value - Refers to the current market value of the illiquid assets in the given asset class/asset.
- Net Investment - Refers to how much total has been invested into the illiquid asset in the asset class, or the illiquid asset
- Total Gain/Loss- The difference between Estimated Value and Net Investment.
- Net IRR - The Net Internal Rate of Return for each asset. The Net IRR is simply the IRR after adjusting for fees and carried interest.
Liabilities

- Outstanding Balance: This denotes the Outstanding balance of all of your Liabilities combined.
- Type of Liability: Sort and view your liabilities by their type which include, Debt, Credit and Indirect.
- Liabilities: A list of the Liabilities and in grey it refers to the Entity that the Liability falls under.
- Last Reconciled: Refers to the last time financial records regarding the particular asset were last reviewed and confirmed for accuracy.
- Outstanding Balance: Refers to the outstanding balance regarding that particular Liability.
- Estimated Payment: The estimated payment and in the grey is the time frequency of each payment.
Capital Tracking Row
Capital Calls

- Currency - Capital Calls are grouped into their respective currencies. In this sample portfolio we only have capital calls in United States Dollars; however, capital calls may exist in a variety of different currencies.
- List of Assets - A list of Assets. Below the asset is the corresponding entity.
- Commitment - How much Capital has been committed in total including both Capital that has been called and/or is remaining.
- Total Called - How much Capital has been called overall.
- Total Remaining - How much Capital is still remaining to be called. This is the difference between our commitment and Total Called capital.
- Called in 2023 - Refers to how much capital, if any, has been called in the year corresponding to the Capital Calls summary.
- Potential in 2023 - The maximum amount of capital than be called for the rest of the year.
- Summary/Schedule - Switch between the Summary and Schedule views.
Clicking on an asset brings up its own summary. After clicking Fixed Income Fund a Holding Details Summary pops up which has a variety of statistics amalgamated from both the summary and Schedule tabs.
 Clicking on Capitals calls gives you a list of Scheduled and Called Capital Calls. This includes the dates, the amount and the percentage of Capital Commitment the call is. In addition, there is also the functionality of adding Scheduled and Historical calls here

Schedule Page
Below is a schedule page which list out Capital Calls, both passed and upcoming, for the selected year. This option is selected in top right corner where the user can switch between the Summary page and the Schedule page.
- Year- Change the current year. Any years prior will include Called Capital and any years ahead will include Scheduled Capital Calls.
- Capital Called - Refers to how much Capital has been called already this year. In this case there was only one capital call this year in Q2 for $1,000,000.
- Potential Rest of the Year - Refers to how much capital can potentially be called for the rest of the year. In this case this refers to Q3 and Q4.
- List of Assets - The list of assets with capital commitments. As stated previously, each asset is grouped by its respective currency.
- Quarter - Each year selected will have details specified by quarter.
- Capital Call - Each rectangular entry that is shaded in refers to a past Capital Call.
- Potential Capital Call - Each white rectangular entry refers to Potential Capital to be called.
Insights
Benchmarks
The Benchmarks lens allows you to view Asset Class/Asset returns against a wide variety of benchmarks and time horizons.

- Select Asset Class - Select the Asset Class to which you want to compare against a particular benchmark.
- Benchmarks - When selecting an Asset Class this field with auto-populate with the best available benchmark for that Asset Class. However, you may change this as you would like.
- Time Metrics - Compare your Assets Classes/Benchmarks against a variety of time periods.
- List of Assets - Get a List of Assets within that Asset Class
Correlations
In the Correlations lens you can compare various investments to a given benchmark using Correlation coefficients and Net IRR

- Benchmark Selection - Choose amongst a variety of benchmarks.
- Correlation - Correlation between an Asset and its benchmark (calculations below.)
- Net IRR - The Net Internal Rate of Return for each asset. The Net IRR is simply the IRR after adjusting for fees and carried interest (calculations below.)
Correlation Calculation:

In the Correlations lens we are dealing with data over the previous 12 months. However, returns are calculated on a monthly basis for a total of 12 periods (represented by n). For each period, the Benchmarks returns (X) the mean return for the 12 periods is subtracted from the current return and then divided by the Standard Deviation. This is then multiplied by the same calculation but for the Asset returns (Y). The sum of these 12 periods is then added together and divided by 12, for 12 periods.
Correlation will always be between -1.0 and 1.0. A negative correlation implies that the asset and the benchmark are negatively correlated and a positive correlation implies that they are positively correlated.
Net IRR Calculation:
Coming Soon
4. BABA - Here you can see that Ali Baba has a low correlation over the last twelve months and a very low Net IRR. Furthermore, by clicking int the security you are able more information like Total Gain Loss and Asset Tags.

5. QQQ - Here you can see that QQQ has a very high correlation of 0.96 to the S&P 500 which is very high. This means that QQQ generally moves in tandem with the S&P 500. As QQQ is an ETF this is not much of a surprise.

7. Filter -The Filter option allows you to pick what asset classes are shown on the graph as seen below. Currently, all assets are selected; however, the user can select the Asset Classes of their choices.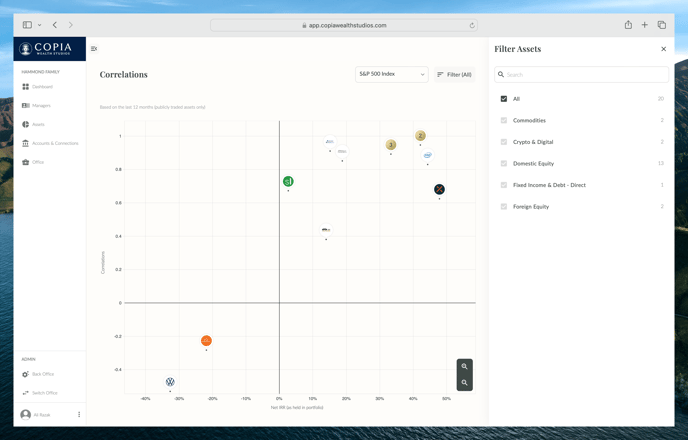
Alternative Performance
The Alternative Performance Lens allows the user to analyze Net IRR against Risk level of a given asset. 
- Net IRR - The Net Internal Rate of Return for each asset. The Net IRR is simply the IRR after adjusting for fees and carried interest.
- Risk - Measures the level of Risk the asset has on a scale from 1-5. This metric may be changed by the user at anytime.
- Net IRR/Total Return - Choose between whether you want Net IRR or Total Return shown on the x - axis.
- Filter - Allows you to pick what asset classes are shown on the graph as seen below. Currently, all assets are selected; however, the user can select the Asset Classes of their choices.
Documentation
K1-Tracker
The K-1 Tracker allows the user to track the document status per year of K-1's and allows the user to track the status of machine learning
On the left hand side we have a variety of assets and in the box on the right hand side we have their status. ![]()
In the Right hand corner we can change the respective year around. We can also add assets to the K-1 Tracker by clicking the +Add button.
![]()
Access the K-1 document after clicking the respective asset from the main screen. In the top right hand corner we can access the underlying K-1 document. In order, for these to appear you must add them in the back office.
For the bottom arrow you can see the many of the data fields being updated. These are updated via Machine Learning and the numbers should match those of the K-1 document.